Segment offset st duration 4 minutes. ST segment change during ischemia
The shift of the ST segment relative to the isoelectric line down (depression) is the reason for a more detailed examination of the patient, since the presence of such a change makes it possible to suspect ischemia of the heart muscle.
It should be remembered that the analysis of this segment alone from the overall picture of the electrocardiogram is not informative enough. A correct conclusion is possible only after a comprehensive detailed analysis of the recording in all leads.
What is the ST segment?
A segment on a cardiogram is a section of the curve located between adjacent teeth. The ST segment is located between the negative S wave and the T wave.
The ST segment is a fragment of the electrocardiogram curve, which reflects the period during which both ventricles of the heart are fully involved in the excitation process.
The duration of the ST segment on the ECG depends on the frequency heart rate and changes along with it (the higher the heart rate, the shorter the duration of this section on the cardiogram).
Each of the sections of the electrocardiographic curve has its own diagnostic value:
Element | Meaning |
The same shape and size of the positive P wave and its presence before each QRS complex is an indicator of normal sinus rhythm, the source of excitation in which is localized in the atriosinus node. With a pathological rhythm, the P wave is modified or absent |
|
Determined by the process of excitation of the interventricular septum (depolarization of the interventricular septum) |
|
It reflects the excitation of the apex of the heart and adjacent parts of the heart muscle (depolarization of the main part of the ventricular myocardium) in leads v 4, 5, 6, and in leads v1 and v2 - reflects the process of excitation of the interventricular septum |
|
It is a display of excitation adjacent to the atria (basal) sections of the interventricular septum (depolarization of the base of the heart). On a normal electrocardiogram, it is negative, its depth and duration increase with complete blockade of the left leg of the bundle of His, as well as the anterior branch of the left leg of the bundle of His |
|
It is a manifestation of the processes of repolarization of the ventricular myocardium |
|
An unstable element of the electrocardiographic curve, which is recorded after the T wave and appears due to short-term hyperexcitability of the ventricular myocardium after their repolarization |
|
PQ segment | The duration of this interval indicates the speed of the electrical impulse from the atrial myocardium to the cardiac muscle of the ventricles of the heart. |
QRS complex | Displays the course of the process of excitation distribution in the ventricular myocardium. Extends when blocked right leg bundle of His |
ST segment | It reflects the saturation of myocardial cells with oxygen. Changes in the ST segment indicate oxygen starvation (hypoxia, ischemia) of the myocardium |
P-Q interval | Conducting electrical impulses; an increase in the duration of the segment indicates a violation of the conduction of impulses along the atrioventricular pathway |
Q-T interval | This interval reflects the process of excitation of all departments of the ventricles of the heart; it is called the electrical systole of the ventricles. The lengthening of this interval indicates a slowdown in the conduction of the impulse through the atrioventricular connection. |
On a normal ECG in the limb leads, the ST segment has a horizontal direction and is located on the isoelectric line. However, its position is also recognized as a variant of the norm and its position is slightly higher than the isoelectric line (one and a half to two cells). This picture on the electrocardiogram is often combined with an increase in the amplitude of the positive T wave.
The greatest attention to this segment in the analysis of the electrocardiogram is given in case of suspected coronary heart disease and in the diagnosis of this disease, since this section of the curve is a reflection of oxygen deficiency in the heart muscle. Thus, this segment reflects the degree of myocardial ischemia.

ST segment depression
The conclusion about depression of the ST segment is made when it is located below the isoelectric line.
The descent of the ST segment below the isoline (its depression) can also be registered on the cardiogram healthy person, in this case the position of the electrocardiogram curve on section S-T does not fall below half a millimeter of the isoelectric line.


The reasons
When analyzing an electrocardiogram, it must be taken into account that the modification of some of its elements can be caused by medications that the patient takes, as well as deviations in the electrolyte composition of the blood.
The shift of the ST segment down relative to the isoelectric line is a non-specific sign. This electrocardiographic phenomenon is observed in various leads in a number of conditions:
- Subendocardial or acute transmural ischemia (with acute myocardial infarction).
- Acute myocardial ischemia of the anterior wall of the left ventricle. It may also be indicative of ST elevation in chest leads.
- Acute ischemia of the lower wall.
- Impact result medicines class of cardiac glycosides.
- Hyperventilation of the lungs (an excess of oxygen in them).
- Reduced potassium content in the peripheral blood (hypokalemia) - in this case, there is a possibility of an additional U wave.
- Hypertrophic changes in the left ventricle, which in some cases can be interpreted as a sign of its overload.
- The horizontal downward displacement of this segment is specific to chronic course insufficiency of coronary circulation with myocardial ischemia.
- Vegetovascular dystonia.
- Pregnancy. During this period, a shift of the ST segment below the isoelectric line may be recorded against the background of tachycardia; the degree of depression in these cases does not exceed 0.5 mm.
A change in the ST-T complex in the form of its downward displacement relative to the isoelectric line can also be caused by a complex of reasons. For example, in a patient with myocardial hypertrophy (of any origin) and receiving therapy in the form of cardiac glycosides, there is a possibility of acute subendocardial ischemia.
The detection of ST segment depression is the reason for a thorough analysis of the electrocardiogram recording in all leads for a more accurate diagnosis of the localization of the lesion.

Clinical manifestations
In typical cases, ischemia (hypoxia) of the myocardium is manifested by pressing pains, discomfort, burning sensation in the chest area. Irradiation is characteristic pain in the back and left upper limb. A painless form of myocardial ischemia is also possible, manifested by discomfort in the retrosternal space, tachycardia, a decrease or increase in blood pressure, heartburn, shortness of breath.
In the differential diagnosis of ischemic myocardial damage with VVD, the features of the clinical picture are taken into account: vegetovascular dystonia is characterized by ST depression in a young patient, more often women, against the background of an increase in heart rate, in the absence of symptoms typical of angina pectoris. In this case, changes in the electrocardiogram are regarded as "non-specific" or as "signs of increased influence of the sympathetic nervous system".
With transient ischemia, Holter monitoring (ECG recording during the day) helps to make a diagnosis. Holter shows all episodes oxygen starvation heart muscle of patients that occurred during the day.

Holter application
Treatment of conditions associated with ST segment depression
In order for the treatment to be effective, it is necessary to act directly on the cause of hypoxia, which is determined using special methods examinations. Possible reasons are as follows:
- atherosclerotic vascular lesions;
- unbalanced diet containing excessive amounts of cholesterol;
- emotional overstrain;
- Availability bad habits;
- sedentary lifestyle;
- excessive physical activity with the unpreparedness of the body;
- metabolic disorders in the body leading to obesity;
- diabetes.
In the treatment of myocardial ischemia, complex therapeutic regimens are used, consisting of the following drugs described in the table:
Group | Drug names | Effect |
Antiplatelet agents | Acetylsalicylic acid, Thrombo ACC, Cardiomagnyl | Prevent aggregation of blood cells, improve its rheological properties |
Nitroglycerin, Nitrosorbide, Nitrospray, Nitromint, Isoket | Expand the vessels of the coronary pool and improve blood supply to the myocardium |
|
Adrenoblockers | Metoprolol, Atenolol, Propranolol | Normalize arterial pressure and heart rate |
Simvastatin, Atorvastatin | Reduce blood cholesterol levels to prevent atherosclerotic vascular disease |
With insufficient effectiveness of conservative therapy, apply surgical methods treatment:
- stenting coronary arteries and (or) their branches;
- coronary artery bypass grafting.
In the treatment of vegetovascular dystonia, the main role belongs to the normalization of the excitability of the nervous system. The amino acid Glycine is capable of normalizing the metabolism of nervous tissue. beneficial effect of this substance on the nervous tissue helps to reduce the astheno-neurotic component.
It is also advisable to use nootropic drugs with an additional sedative effect.
If there are tachycardia or tachyarrhythmia in vegetative dystonia, the use of Corvaldin, Corvalol, and potassium preparations is indicated.
For effective treatment vegetovascular dystonia, it is necessary to observe a protective regime: giving up bad habits, a balanced diet, combating physical inactivity, eliminating stress. High efficiency, especially in the composition complex therapy, show massage, physio and acupuncture.
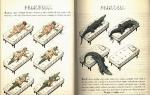
seen in chronic coronary disease hearts. A - horizontal; B - oblique descending; B - with an arc turned convex upwards; G - oblique ascending; D - trough-shaped; E - elevation of the ST segment.
- Horizontal displacement of the ST segment. It is characterized by a decrease in the ST segment below the isoline with its horizontal location. The ST segment changes into a positive biphasic (- +) flattened or negative T wave.
- Oblique downward shift of the ST segment (from R to T). As you move away from the QRS complex, the degree of displacement of the ST segment downwards from the isoline gradually increases. The ST segment becomes negative, biphasic (+) flattened, or positive T.
- Offset of the ST segment downwards from the isoline with an arc turned convex upwards. The depression of the ST segment is not expressed equally throughout its entire length, but has the shape of an arc, the bulge of which is directed upwards. The ST segment becomes positive, biphasic (+), flattened, or T wave negative.
- Oblique upward displacement of the ST segment (from S to T). The greatest depression of the ST segment is observed in this case immediately after the end of the QRS complex. Following this, the ST segment gradually rises to the isoline and usually passes into a positive or smoothed T wave.
- Trough-shaped displacement of the ST segment. This type of ST segment displacement has the shape of an arc, the convexity of which is directed downwards. It is also observed in the treatment of cardiac glycosides. The ST segment becomes a flattened biphasic (- +) or upright T wave.
For chronic ischemic heart disease, the first two types of ST segment displacement are most specific, i.e. horizontal and oblique downward.
"Guide to electrocardiography", V.N. Orlov
ST segment measurement rules
- The ST segment is measured 60 ms (one and a half small cells) from the J point.
- Point J is the place where the S wave passes into the ST segment (or the S wave crosses the isoline).
- Normally, leads V1-V3 may show ST elevation with a maximum in V2 up to 0.25 mV.
- In other leads, elevation of 0.1 mV or more is considered pathological.
ST segment elevation
ST segment elevation can be different shape depending on the reason that caused it. Most common causes ST elevation:
- ST elevation myocardial infarction
- Early ventricular repolarization syndrome (ERVR)
- Pericarditis
- Postinfarction aneurysm
- Brugada syndrome
- Complete left bundle branch block (LBBB)
- Left ventricular hypertrophy
- Variant angina (Prinzmetal's angina)
Shown below are examples of ST elevation in the conditions listed above. Look at each of the complexes, find the J point and calculate the ST elevation 60 milliseconds away. Then check the correct answer:

In the absence of d other signs of myocardial injury (eg, Q wave or deep negative T waves)curved ST elevation usually wears benign character, and the oblique or convex elevation is usually pathological and associated with myocardial ischemia.
There is a good "reminder" for concave and convex ST elevation:

ECG Criteria for Pathological ST Elevation in STEMI
New ST elevation in two or more adjacent leads is considered pathological:
- ≥2.5 mm in V2-V3 and ≥1 mm in other leads in men under 40
- ≥2.0 mm in V2-V3 and ≥1 mm in other leads in men over 40
- ≥1.5 mm in V2-V3 and ≥1 mm in other leads among women
- ≥0.5mm in V7-V9
- ≥0.5mm in V3R-V4R
- If the patient has a complete blockade of LBBB or a pacemaker is installed, the modified Sgarbossa criteria should be used.
- Use Smith's formula to distinguish between LAD STEMI and early ventricular repolarization syndrome (ERS).
ST segment depression
ST segment depression can be of three types:

Ascending ST depression often occurs against the background of tachycardia (for example, during exercise) and disappears with a decrease in heart rate. Such depression is a variant of the norm. Ascending depression progressing to high-amplitude "coronary" T waves may mean acute stage extensive myocardial infarction (the so-called De Winter's T-waves).
Horizontal and downward sloping ST depression, depth ≥0.5 mm in two adjacent leads is a sign of myocardial ischemia (all four examples above).
Always note that ST depression may be reciprocal of elevation in "mirror" leads. Most often, acute posterior myocardial infarction is manifested by horizontal V1-V3 depression and minimal elevation in V6 (to check in such cases, it is necessary to record leads V7-V9), and high lateral infarction - ST depression in II, III, aVF and subtle elevation in aVL (to check, you need to record V4-V6 two intercostal spaces above).
To recap: ST elevation and depression
- Remember that both ST elevation and ST depression can be normal.
- Before accepting such changes as a variant of the norm, exclude all possible pathological causes.
- If you see both ST depression and ST elevation on the same ECG, then suspect STEMI and evaluate the elevation first, as it is much more dangerous. Then analyze the ST depression - it may be reciprocal changes.
In the event that the myocardium experiences a significant or critical oxygen deficiency, a cascade of biochemical changes occurs, as a result of which certain changes appear on the ECG - depression of the ST segment.
Such changes in most cases should be regarded as acute until proven otherwise. But sometimes depression remains on the ECG for years, even in people who do not have problems with the coronary arteries. Only clinical picture will allow you to decide on the tactics of patient management, but we will not talk about the clinic.
And so, first of all, let's see where this ST segment is located on the ECG.
On the left you see a schematic representation of a single complex and ST segment. If you draw an imaginary line (ISOLINE) from the beginning to the end of the complex, then it will just pass through the ST segment. That is, there is neither elevation nor depression here - this is the norm. If the segment were under the isoline, this would be called “depression”, if, on the contrary, above the isoline, then “elevation”.
It should be noted that elevation or depression is not always pathological, it depends on their severity.
normal at rest
in the chest depression should be less than 0.5 mm.
in limb leads depression should be less than 0.5-1 mm.
Let's look at the ECG snippet

First you need to draw an isoline, the accuracy of the measurement depends on the correctness of this stage. Usually, with the help of a ruler, a more or less even section of the isoline is found between two complexes and a line is drawn through them. This will be the isoline. Something like that.

Now it is clearly visible that the ST segment is under the isoline. But what to do now, in what place to measure this very depression? It is clear that you need to attach the ruler vertically and measure from the isoline to the line of the segment itself, but where to do this?

Here you can see that if you choose a place arbitrarily, you can get completely different values of depression. How to proceed? The answer is simple, the measurement must be carried out as follows. It is necessary to find the point (j) where the S wave ends, or if there is no S wave, then the point of intersection of the descending knee R with the isoline. Then set aside 0.08 s (4 mm) from this point and measure the depression (this will be point i) in it. Some foreign authors recommend setting aside 0.04 s. (2 mm). But if there is derpessia, then it is both at 0.04 and at 0.08


In our case, the situation will look like this
 Thus, we can say that in lead V5 there is a depression of up to 0.5 mm (this is the norm), and in V6 it is about 0.8 mm, which is beyond the norm, but does not always indicate true ischemia. In such cases, such depression should be described in the conclusion. And the clinician will already be puzzled about what to do with it, a detailed clinical interpretation is beyond the scope of this course.
The next topic is the most important in the entire section "ISCHEMIA",
ECG changes in angina pectoris and chronic coronary heart disease, they arise not due to a violation of the coronary arteries themselves, but due to increasing myocardial anoxia, due to a lack of blood supply. The manifestations of this condition are nonspecific and may be present in other diseases. Therefore, a clear diagnosis is made on the basis of a complex of ECG signs in combination with clinical symptoms and results. functional tests.
- 1. Horizontal displacement of the ST segment. It is manifested by its displacement almost parallel to the isoline. The ST segment may change into a positive or negative, isoelectric or biphasic T wave.
- 2. Oblique downward displacement of the ST segment. As it extends downward from the isoelectric line and away from the QRS complex, the degree of ST segment depression gradually increases. Sometimes such a shift is called from R to T. Then the segment passes into a positive or negative, isoelectric or biphasic T wave.
- 3. Displacement of the ST segment downwards from the isoline with an arc turned convex upwards. The decrease in the segment is expressed unequally throughout its length, resembling an arc in shape, with a bulge facing upwards. The ST segment changes into a positive or negative, isoelectric or biphasic T wave.
- 4. Oblique upward displacement of the ST segment. The greatest depression in this variant is recorded immediately after the QRS complex. After that, the segment smoothly rises to the isoelectric line and passes into a positive or biphasic T wave.
- 5. Trough-shaped displacement of the ST segment. This type resembles an arc in shape, with a bulge facing downwards, and passes into a positive, isoelectric or biphasic T wave.
- the presence of a negative or biphasic U wave;
- some increase in the duration of the P wave;
- an increase in the QT interval due to the lengthening of the electrical systole of the ventricles;
- a sharp deviation between the electrical axes of the QRS complex and the T wave;
- various disturbances of a rhythm and intracardiac conductivity are often observed;
- various disorders of intraventricular conduction, manifested by splitting of the QRS complex;
Show all
ECG phenomena in angina pectoris and coronary artery disease
With coronary artery disease characteristic changes in the ST segment and T wave are noted on the ECG.
Insufficiency of the coronary arteries and reduced supply to the myocardium arterial blood usually cause depression and a change in the shape of the ST segment, which normally smoothly, unsharply passes into the ascending knee of the T wave. IHD (coronary heart disease) is accompanied by a clear and steep transition of the ST segment into the T wave. This is an early diagnostic sign development of coronary artery disease in a patient. Further progression of the disease will be combined with depression of the ST segment below the isoline, which is associated with subendocardial damage due to myocardial ischemia and characteristic changes in the T wave.
ST segment changes
There are 5 types of ST segment depression:

Most often with angina pectoris, horizontal and oblique downward displacement of the ST segment occurs.
The severity of ST segment displacement is directly proportional to the severity of ischemic changes and coronary insufficiency. Its downward displacement from the isoline by 1 mm or more in chest leads, more than 0.5 mm in standard leads reliably indicates the presence of myocardial ischemia. A slight depression up to 0.5 mm is also found in healthy people.
With angina pectoris and coronary heart disease, elevation (rise) of the ST segment can also be observed. Usually in shape it resembles an arc with a convexity facing downwards. The ST segment in this case passes into a positive or isoelectric T wave. A diagnostically significant rise in the ST segment should be at least 1 mm. In this case, carry out differential diagnosis with myocardial infarction.
ST changes characteristic of angina pectoris and coronary artery disease are most often localized in the left chest leads V4-V6 and leads II, III, aVF, I, aVL.
In acute myocardial infarction and acute coronary insufficiency, similar phenomena of the ST segment occur. The difference between the chronic course of coronary artery disease and angina pectoris will be the absence of changes in dynamics, stability for a long time.

T wave changes
The most specific change in the T wave in angina pectoris and coronary artery disease is the "coronary" T wave (characterized by a pointed, symmetrical shape), often negative. This shape of the tooth is associated with the development of transmural myocardial ischemia. Negative T waves characteristic of CAD are often deep, with an amplitude of 5 mm or more.
Sometimes myocardial ischemia manifests itself as giant positive T waves - a high "coronary" T wave. This change occurs in other diseases (hyperkalemia, pericarditis) and is not pathognomonic.
And also with coronary artery disease and angina pectoris, two-phase T waves can be recorded: + - or - +. More often, the recording of such teeth occurs when the recording electrode is located peripherally from the ischemic zone.
In chronic ischemic heart disease and angina pectoris, a smoothed, reduced, isoelectric T wave is sometimes recorded. More often, a decrease occurs in most of the main leads.

Another sign of coronary heart disease is the ratio of T V1 > T V6 and T I< T III.
Most often, pathological T waves are recorded in the left chest leads, in I, aVL, and also in III, aVF leads. In the right chest leads V1-V2, changes in the T wave with angina pectoris are observed much less frequently.
Negative T waves should be differentiated during ischemia and during dynamic changes without organic damage myocardium. To do this, a Valsalva test, a test with hyperventilation, potassium, obzidan, an orthostatic test are performed, and if the negative T wave turns into a positive one, this indicates against the presence of angina pectoris and coronary artery disease.
The ECG conclusion is not a diagnosis. The final verdict is made by a cardiologist based on clinical symptoms, ECG signs, as well as the results of functional tests and studies.

Additional ECG symptoms
These symptoms may not always occur or be combined with other diseases not associated with coronary artery disease and angina pectoris. Only by these signs it is impossible to assume the presence or absence of the disease, they are only additional markers to the main ECG symptoms of coronary artery disease.
Signs that indicate the likely presence of coronary artery disease and angina pectoris include:
ECG changes during an angina attack
During the onset of an attack of heart pain during angina pectoris, ST segment depression, combined with T wave inversion, can be observed on the ECG. But usually these are incoming changes that are not always possible to register due to their short duration. After the end of the attack, the ECG usually returns to its original form. Changes in the myocardium with the onset of pain are associated with diffuse myocardial hypoxia.
Usually an attack of angina pectoris is provoked physical activity, emotional outburst, stress.
Features in Prinzmetal's angina
This is a special variant of angina in which the attack occurs at rest or during normal daily activities and is not associated with any kind of stress.
The ECG is characterized by the presence of an ST rise with a transition to a positive T wave. As a result, a monophasic curve is recorded. On the opposite wall of the myocardium there will be reciprocal changes (reverse to existing ones), i.e., a decrease in the ST segment.
Changes in Prinzmetal's angina persist for some time, and then return to the initial level. It is assumed that this is due to the coming spasm of the coronary arteries.